We write a lot in the Edge of Chaos blog about visualization, and how helpful it is for project management, problem-solving, strategic thinking and learning. No matter if you’re an executive who wants to contemplate a business challenge from various perspectives, a software developer, or a strategizer, nothing can be as handy a tool as a pen and paper (or, in some cases, a digital screen) to hone your ideas and give them a finished touch. Visualizing ideas helps to drive the point home not only with yourself, but with the others, if you want to make sure that they understand what you mean.
Let me share some of my favourite ways to visualize ideas.
#1. An XYZ Coordinate System
I like this way of visualizing as it helps to build mental models that show how 3 factors might influence one another. Yes, they have 2D coordinate systems, X and Y, and I do use them, too, but in the complexity of today’s world where more than two factors often have to be taken into account, 3 D visualization might work out better. Here’s the image that I used in one of my articles to explain how backlog management can be done with 3D thinking, as opposed to 2D (backlog and work in progress). X-axis is work, Y-axis is progress, the X-Y plane is any work in progress AND Z-axis is any other 3d dimension, or a lens, through which one can filter the backlog or work in progress. The red lines in the Z-plane against the X-Y plane represent those various influences, or filtering criteria. The artistic execution might be far from perfect, but this image did help me express my idea better and pass it on to the readers:

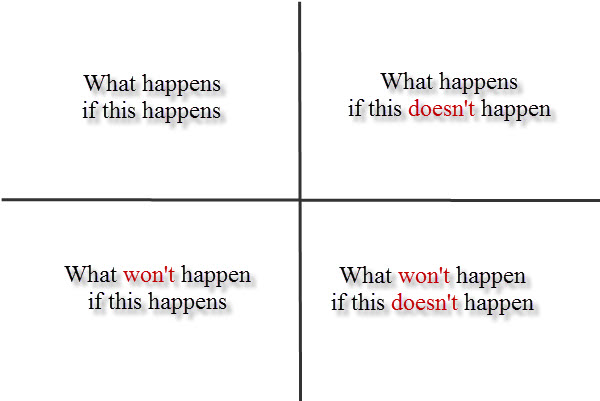
#2. 4 Quadrants
I used this visualization to explain a decision-making technique. While the XYZ coordinate system provides some kind of 3D space to a concept, making it concrete, the 4 quadrants can be used to break abstract concepts into pieces. It might be helpful, for example, to write out 4 major areas of concern about a problem or a challenge, look at them and drill them down to smaller resolvable issues. This technique helps to think clearly.
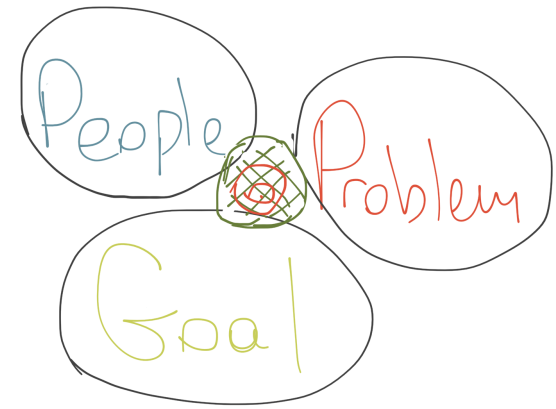
#3. Overlapping Circles
I somehow feel that this pattern have been overused to visualize a very simple overlap of 2 concepts, e.g. one circle stands for “good”, the other stands for “bad”, and the overlapping area is the mixture of good and bad, which is kind of obvious without using circles. So, I’m not very fond of this practice, because it looks a bit trite, but I did use it several times, e.g. to show that business meetings are made up of 3 essential components mixed as in a bowl:
#4. Mind Maps
They work well to connect the idea nodes and summarize the concepts that someone already knows well. I’ve written the Mind Maps in Cognition article which suggests some points on when it makes sense to use mind maps, and when not. Here’s the mind map that I sketched as a summary of knowledge that software product owners need to have:

#5. Custom Spatial Objects
That’s the visualization that I used to explain the idea of a new paradigm for project management tools. I had a sketch of this idea on paper, but this time someone helped me with a nice image:
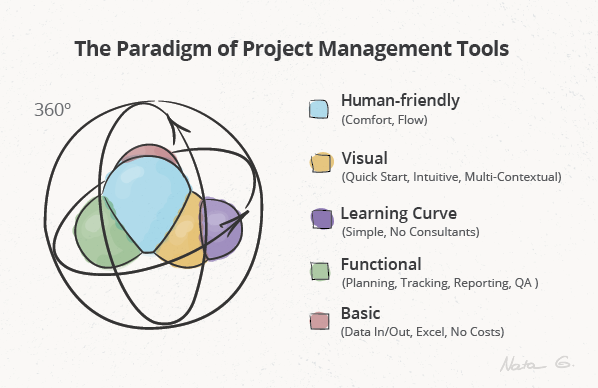
This molecule glues the core paradigm to the other paradigms, rotating and gaining various momentums, depending on where they find themselves in space at any given point of rotation. The rotation is a symbol for changing goals and organizational environments, and the way they influence project management tools.
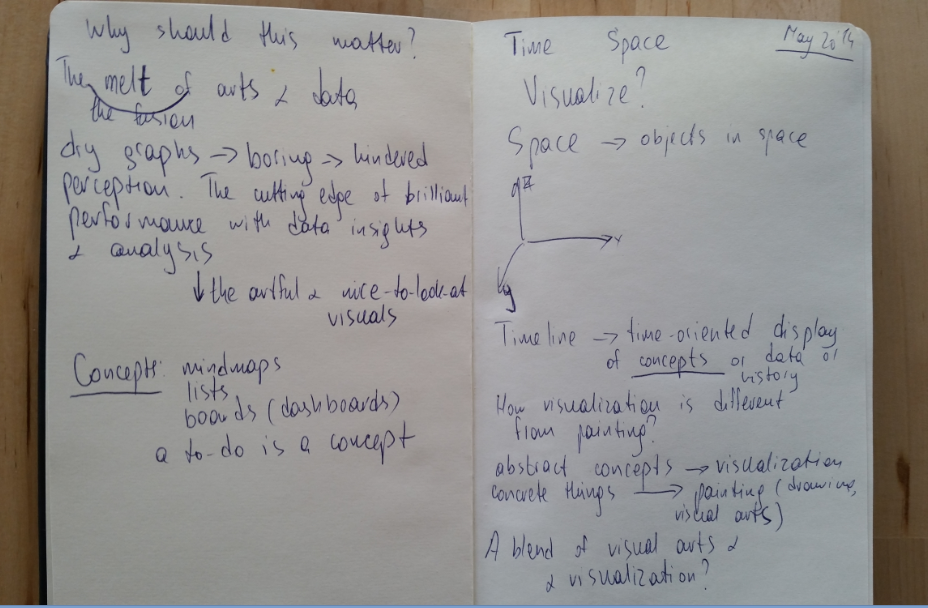
#6. Sketches in Moleskine notebooks (no grid lines)
I find this especially inviting when a sheet of paper has no grids. This freedom of paper space somehow encourages the freedom of thinking. An A4 sheet of paper does not do this trick for me, because a Moleskine notebook has pages, that can be flipped, and they can be kept for future use as a collection. Also, for some reason I like to start sketching on the right side of the double-page spread, and then continue on the left one, same way they do when they write in Arabic. I do idea sketches for my articles this way sometimes. Here’s the idea sketch for my recent article Visualization: Why the Fusion of Arts and Tech Matters:
Related articles:
Visualization: Understated or Overrated?
Visualization and 5 Senses
Visualizing Music
Why Visualize?
Mind Maps in Cognition


